Real Growth (GDP)
The rate at which St. Maarten’s Gross Domestic Product changes
from one year to another
7.10% (2021)
Price indication
The measurement of price changes in a basket of goods and services
113.49% (Q2 2024)
0.16% (Q2 2024)
Tourism
Measuring the flow of tourism arrivals
320,153 (2024)
878,091 (2024)
- All
- Factors
- Yearbook
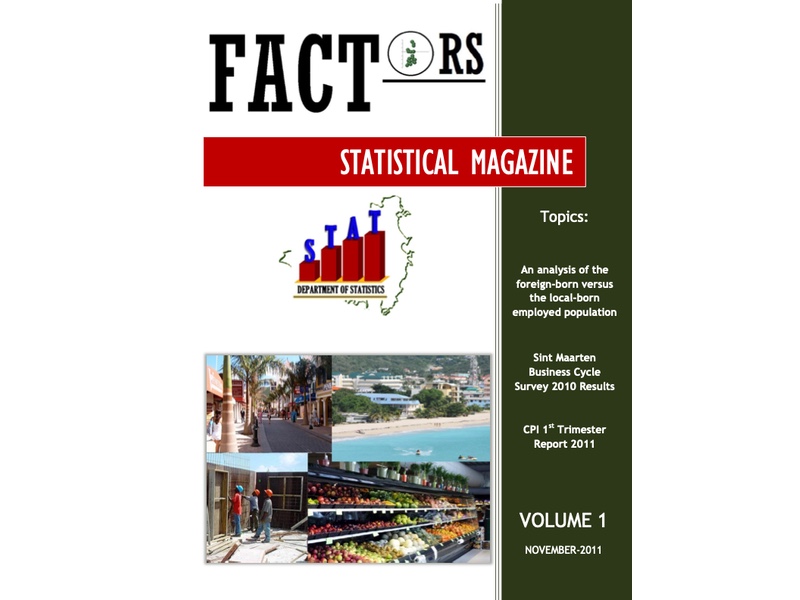
Volume 1
Foreign-born vs local-born - Employed population
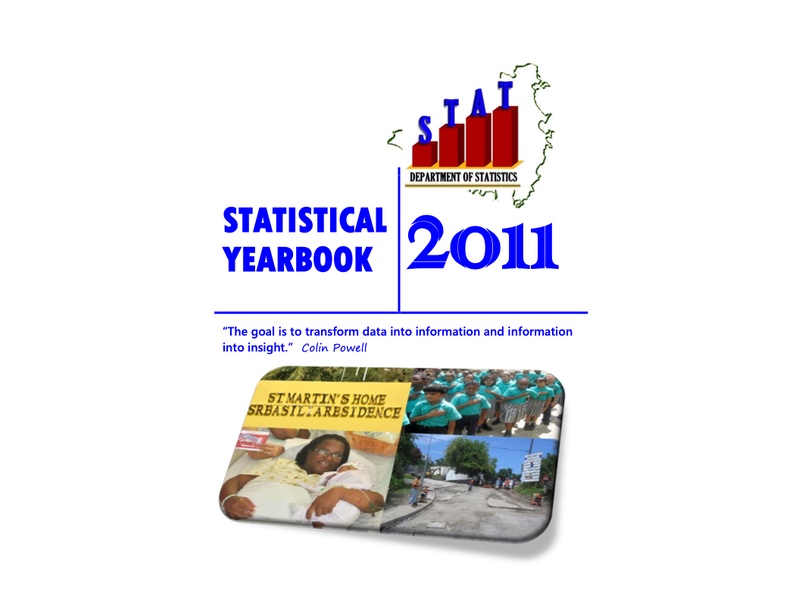
Statistical Yearbook 2011
The Goal is to transform data into information and information into insight
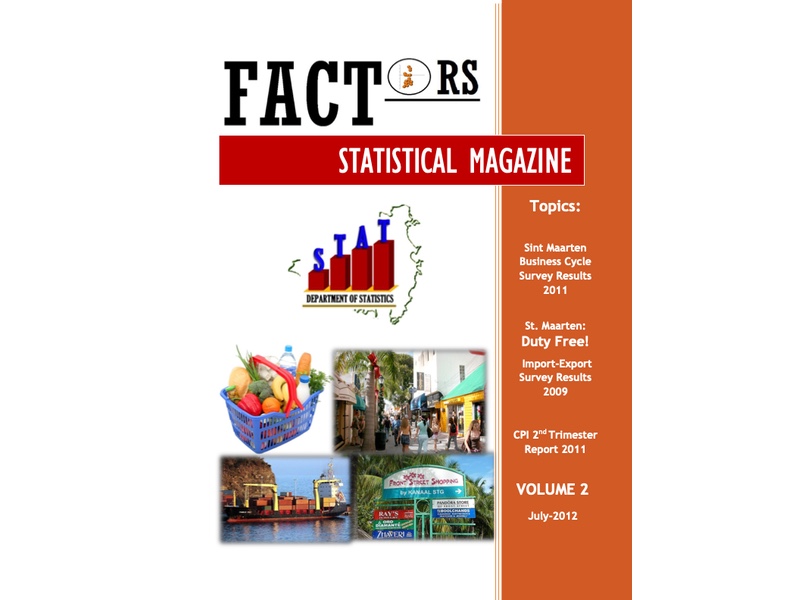
Volume 2
Business Cycle Survey 2011 - Import-Export 2009 results
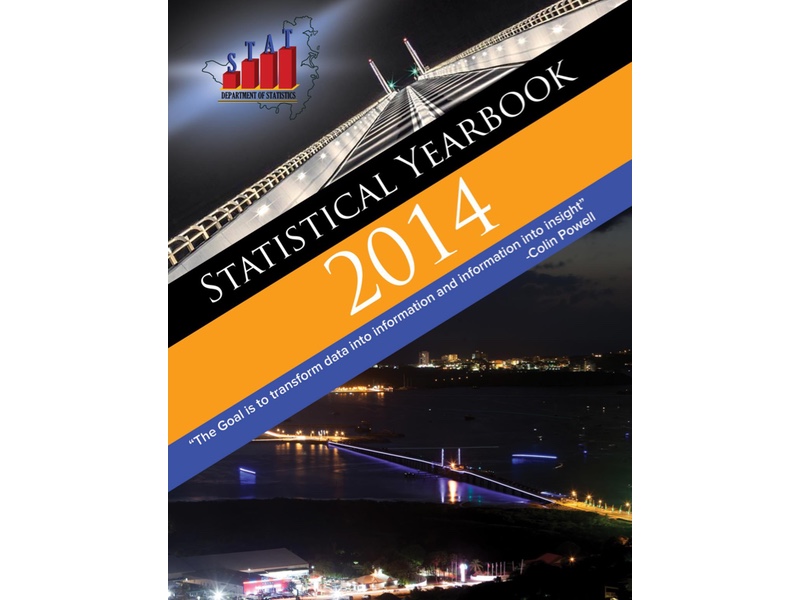
Statistical Yearbook 2014
The Goal is to transform data into information and information into insight
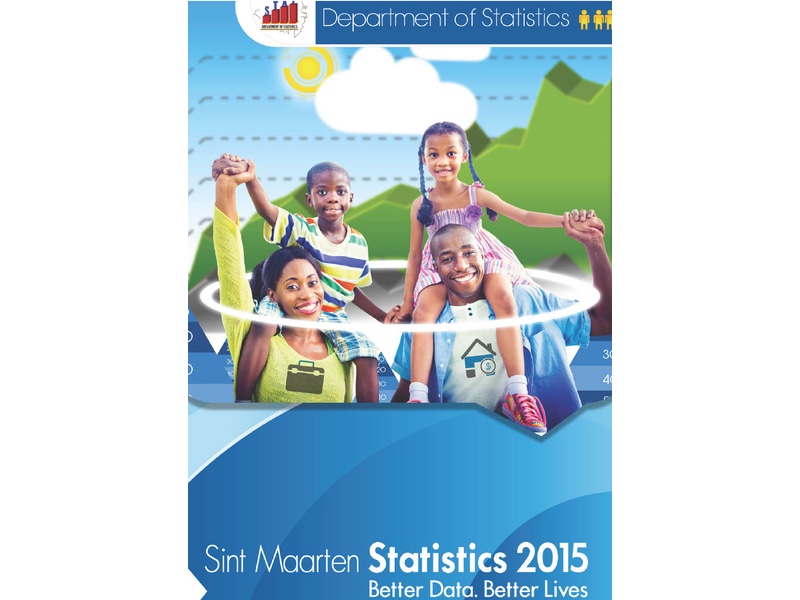
Statistical Yearbook 2015
Better Data. Better Lives.
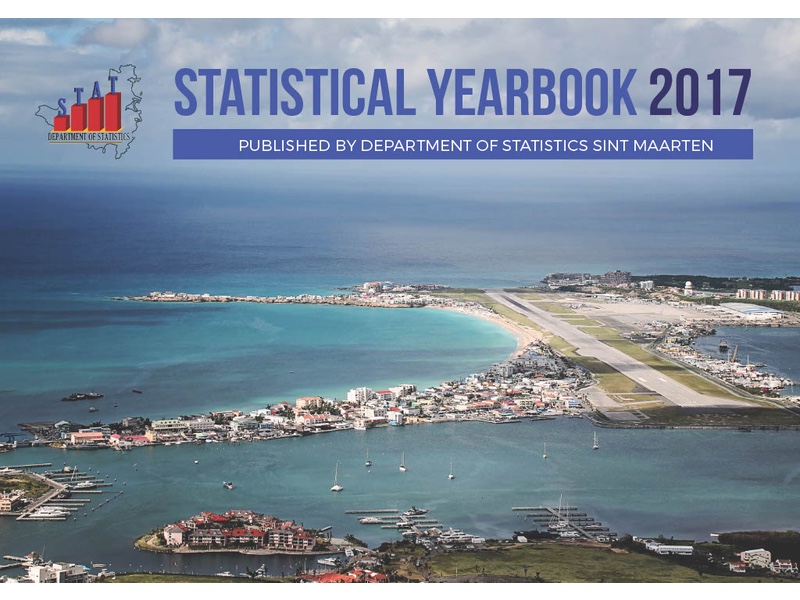
Statistical Yearbook 2017
St. Maarten's population, election results, health & education sectors, labour market, economy, tourism & aviation industries and much more
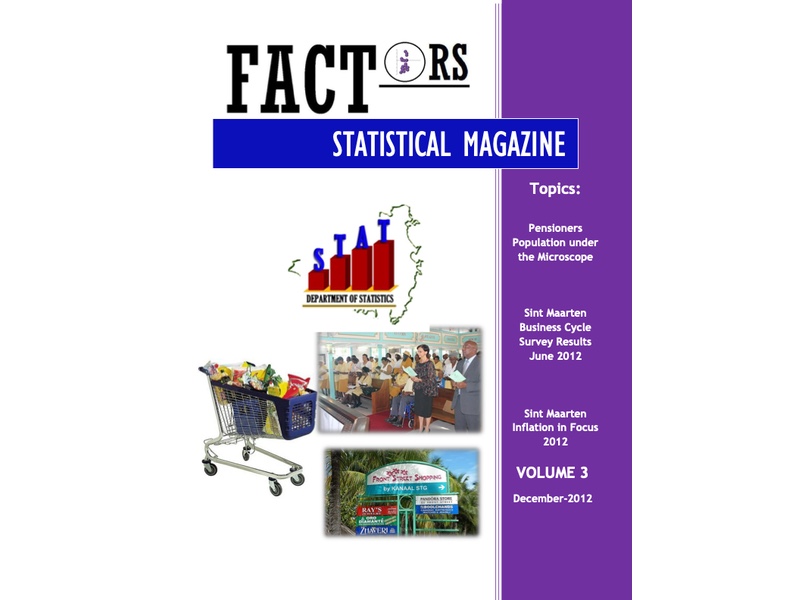
Volume 3
Pensioners Population under the microscope - BCS Results June 2012
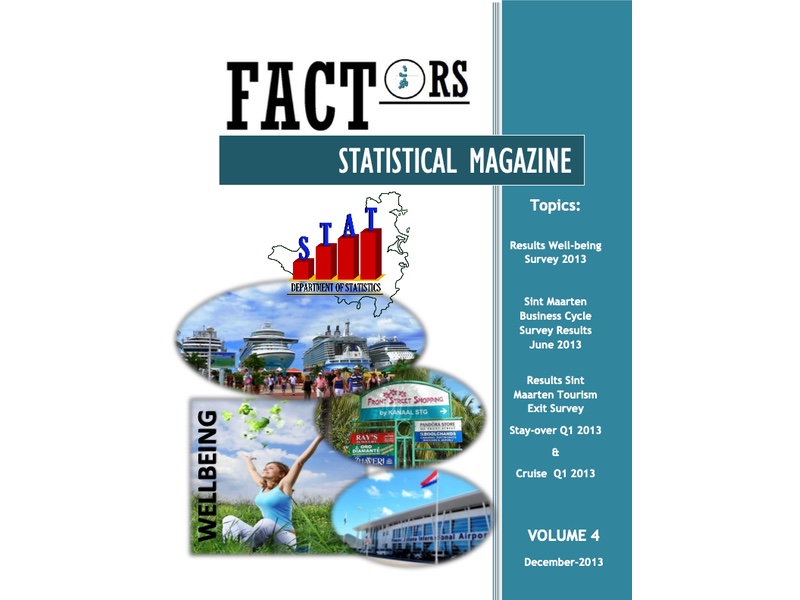
Volume 4
BCS June 2013 - TES results (Stay-Over + Cruise q1 2013)
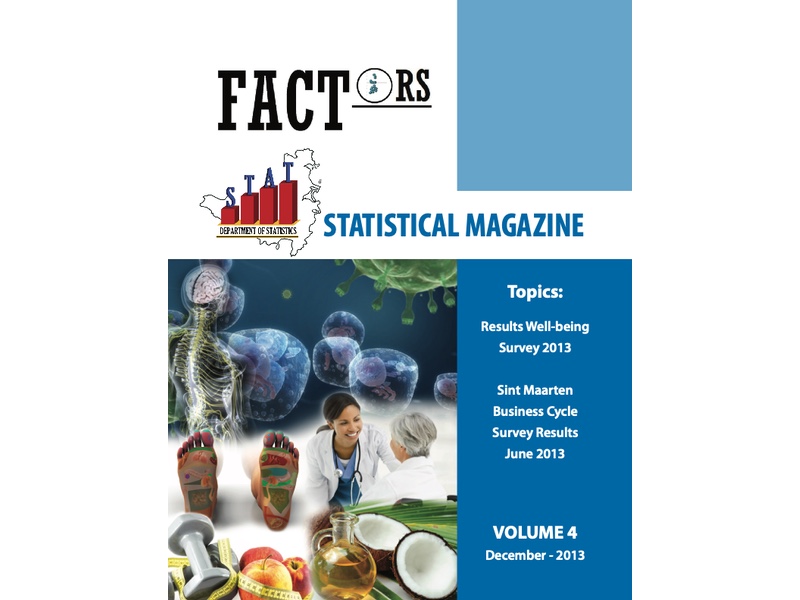
Volume 4-1
Busines Cycle Survey Results June 2013
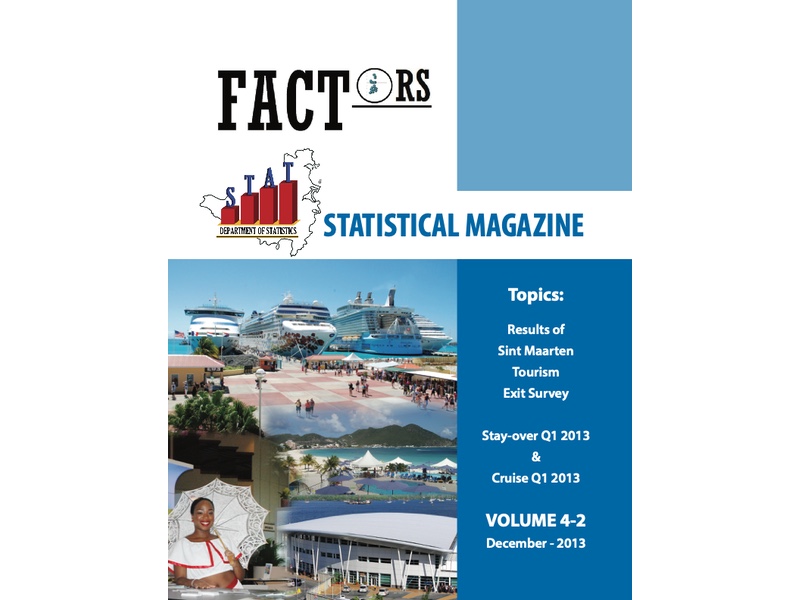
Volume 4-2
TES results (Stay-Over + Cruise q1 2013)
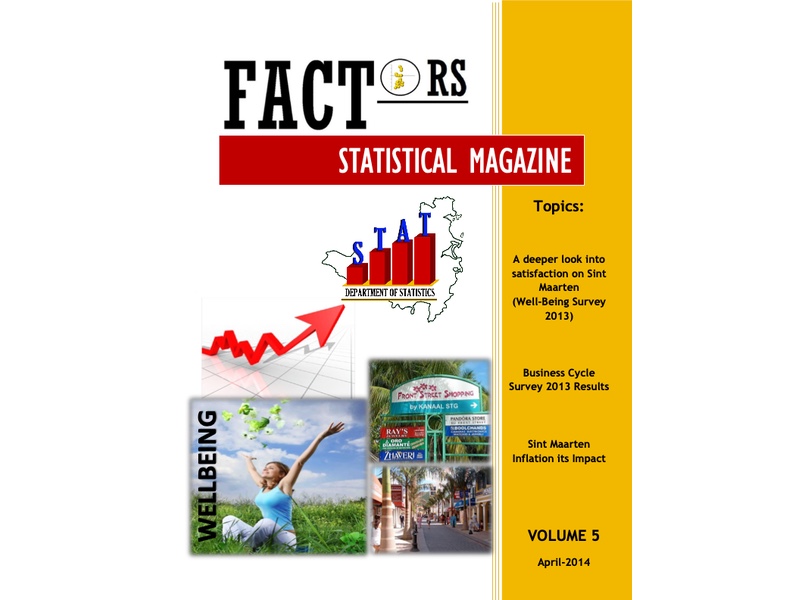
Volume 5
Well-Being Survey 2013 - Business Cycle Survey 2013 Results - Sint Maarten Inflation its Impact
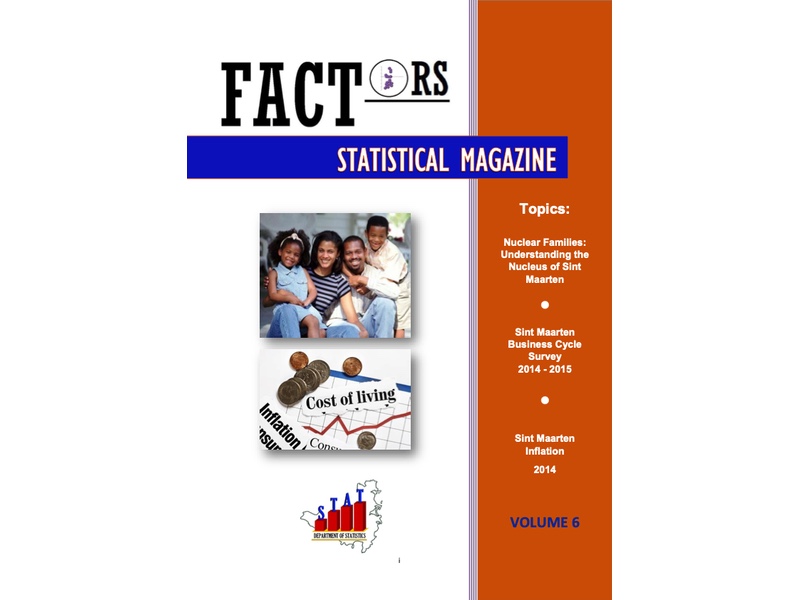
Volume 6
Understanding the Nucleus of Sint Maarten - Business Cycle Survey 2014 & 2015 - Sint Maarten Inflation 2014
